

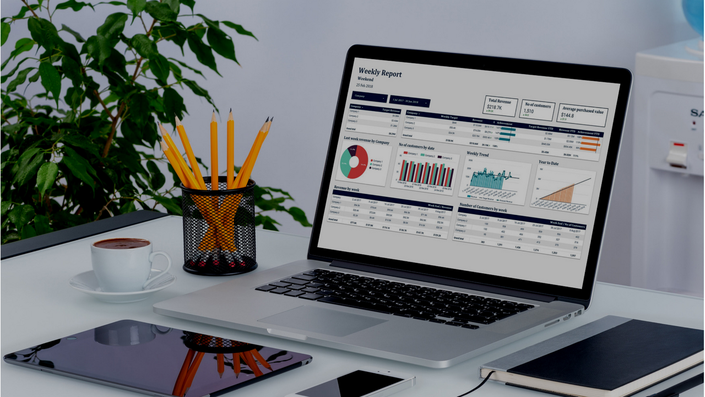
Financial Dashboard in Google Data Studio
Building Financial Dashboard in Google Data Studio from Scratch
This course instructs how to build Financial Dashboard in Google Data Studio From Scratch
- Create Powerful Interactive Financial Dashboards from Google Sheets Data from scratch.
- No VBA or SQL coding require, just drag and drop, copy and paste.
- Analyze Google Sheets in minutes using powerful visualizations.
- Learn powerful visualizations such as Time Series Charts, Scorecards, Pie Charts, Stacked Area Charts.
- Display comparisons to Previous Period, Previous Year, in one scorecard.
- Create Financial Year to Date Calculations.
- Create filters to easily create interactive dashboards, graphs and reports.
- Create date range selection to easily manage the display range in the charts .
- Share Reports and Updating Data.
- Create pages navigation to make a report look like running in a professional financial software.
- Learn how to Fix error.
- Free access to the report anytime, anywhere by signing in Google Account.
Your Instructor

Sterling Data Studio is a team training how to use Google Data Studio quick, efficient and professional.
Frequently Asked Questions
When does the course start and finish?
The course starts now and never ends! It is a completely self-paced online course - you decide when you start and when you finish.
How long do I have access to the course?
How does lifetime access sound? After enrolling, you have unlimited access to this course for as long as you like - across any and all devices you own.
What if I am unhappy with the course?
We would never want you to be unhappy! If you are unsatisfied with your purchase, contact us in the first 30 days and we will give you a full refund.